Why the Long Change Creates Hockey's Hardest Minute
The second period is not dangerous because every identical shift is worse. It is dangerous because tired players are furthest from the bench exactly when they need the bench most.
Editorial preview. Canonical research draft:
research/2026_long_change_effect.md.
Every hockey person knows the long change is hard. The second-period defensive zone is on the far side of the rink from your bench. Tired forwards have to skate further before relief comes over the boards. The line you wanted out there at 4:30 of the period ends up out there at 5:10 because the change cannot get on cleanly. Coaches talk about it constantly. Broadcasts mention it every game.
What we do not say as often is how much the long change actually matters, and which teams it matters most for. The public data makes the answer more specific than “everybody gives up more goals in the second.”
What the long change actually is
Two things stack on top of each other in the second period. Most coaches think about the first; not enough teams plan around the second.
Start with the geography. In periods 1 and 3, your defensive zone is the near zone, the one you defend with your bench eight feet behind you. Bad reads can be fixed by a quick change. In period 2, the defensive zone is the far zone. The change is a full sheet of ice away. A tired defenseman has to skate the long ice before he gets off, and a winger who wants to come over the boards has to wait for the puck to settle into a safe area.
Then fatigue compounds it. A 40-second shift in period 1 is roughly fine because the player can change as soon as the puck turns. A 40-second shift in period 2 is a 40-second shift that then needs another five to ten seconds of survival before the bench can swap. The defender who was already tired gets one more cycle’s worth of tired.
Coaches who do this well prepare for both. They pre-scout the opponent’s late-shift reads. They have their D-pair changes timed to puck recoveries rather than icing chances. They line-match with the long change in mind, not just with personnel in mind. The teams that do not plan for this lose chances against in exactly the worst situations.
How big is the effect
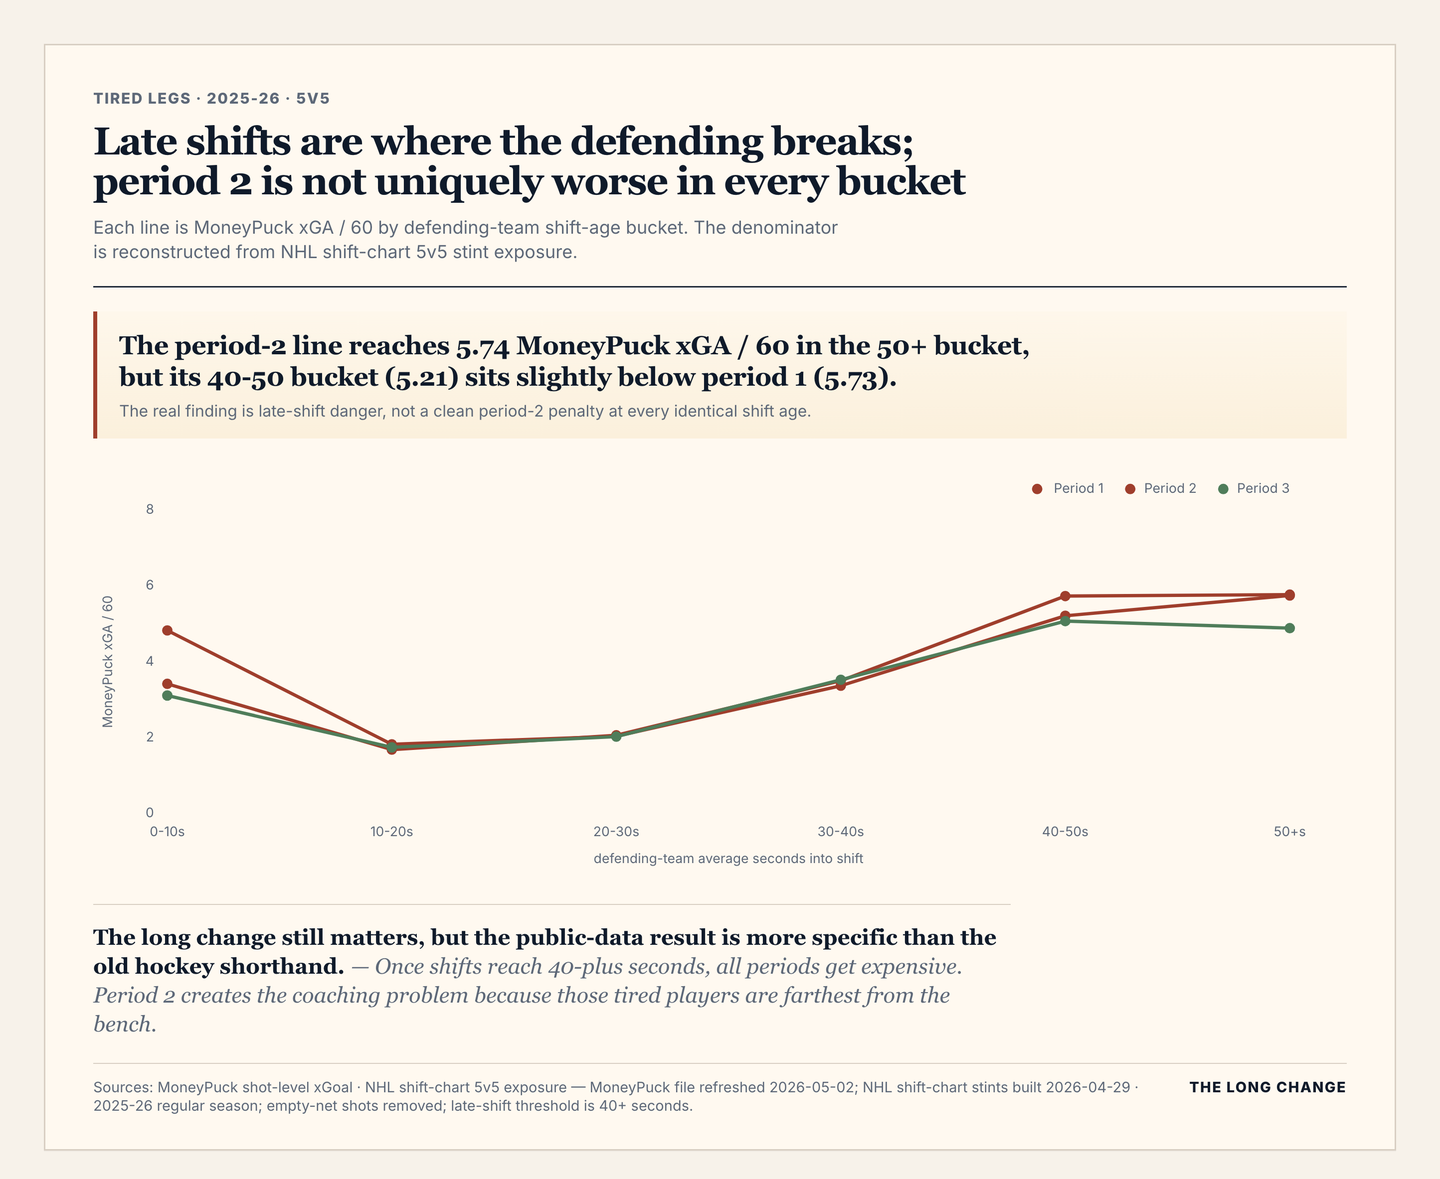
The chart is built from 2025-26 regular-season 5v5 MoneyPuck shot rows, bucketed by the defending team’s average time on ice when the chance arrived. The per-60 denominator is reconstructed from NHL shift-chart 5v5 exposure. Two things stand out.
First, late shifts are expensive. The 10-30 second bands live around 1.7 to 2.1 MoneyPuck xGoal against per 60. Once the defending team gets to 40-plus seconds, the rate climbs to roughly 5.0-5.8 MoneyPuck xGoal against per 60 in periods 1 and 2, and to just under 5.0 in period 3. One caution on reading that slope: shift age isn’t randomly assigned. A team that’s hemmed in its own zone can’t change, so long shifts and chances against partly cause each other. That is why the cross-period comparison is the part of this chart you can lean on — the getting-hemmed-in mechanism exists in every period, and the long change is one of the reasons it happens more in the 2nd.
Second, the period-2 line does not run above the others the whole way. At 40-50 seconds, period 2 is 5.21 MoneyPuck xGoal against per 60, below period 1 at 5.73. At 50-plus seconds, period 2 is 5.74, essentially level with period 1 at 5.77 and above period 3 at 4.88.
The hockey translation: the long change is not a magic period-2 multiplier at every identical shift age. It is the period where a tired group has the worst geography for getting off the ice. The danger is still real; the mechanism is more precise than the shorthand.
Where the chances actually come from
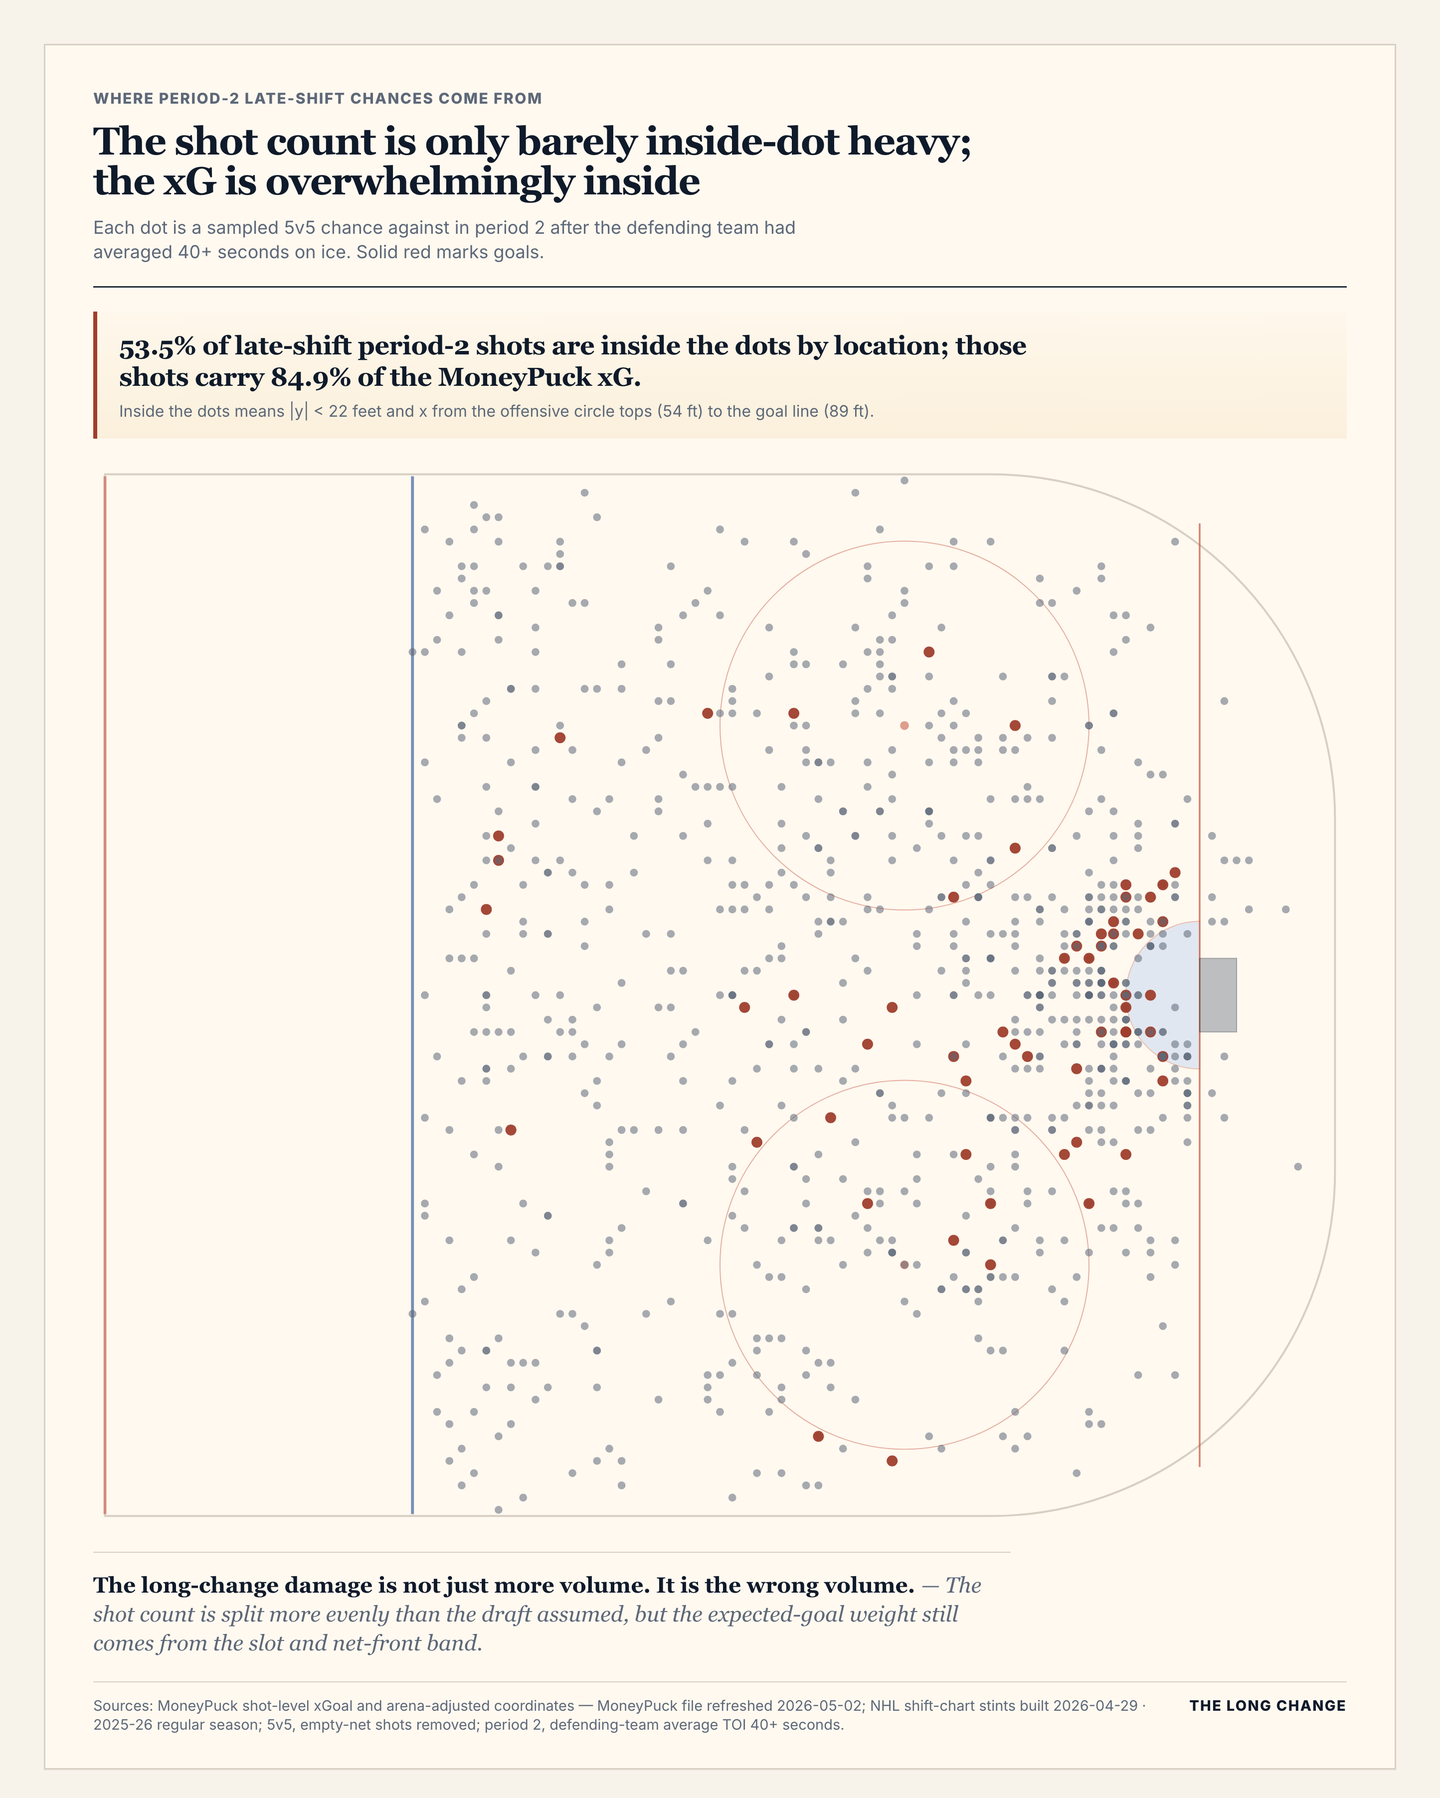
The other thing the long change does is change what kind of chance the defense gives up.
If you watch enough late-shift period-2 minutes, you start to see the same plays. A winger who has been chasing in the offensive zone arrives at his defensive-zone responsibility a step late. The center is too tired to win the second puck after a faceoff loss. A defenseman reads pass and reaches for a stick when he should be skating, and the second forward arrives at the back post unmarked.
The shot map sharpens the point, but it also trims the draft claim. The chances are not overwhelmingly inside the dots by count. Using a MoneyPuck regular-season non-empty-net shot location definition of |y| < 22 feet and x from the offensive circle tops to the goal line, 53.5% of period-2 late-shift shots are inside the dots. By MoneyPuck xGoal, though, that same band carries 84.9% of the danger.
That matters. The long change is not just producing an extra shot from anywhere. It is producing enough slot and net-front weight that the chance quality bends toward the middle of the rink, even when the raw shot count is closer to even.
Coaches call this losing the backside. Everyone in the rink can see it happen in real time; the shot map just puts numbers on it.
Where teams actually differ
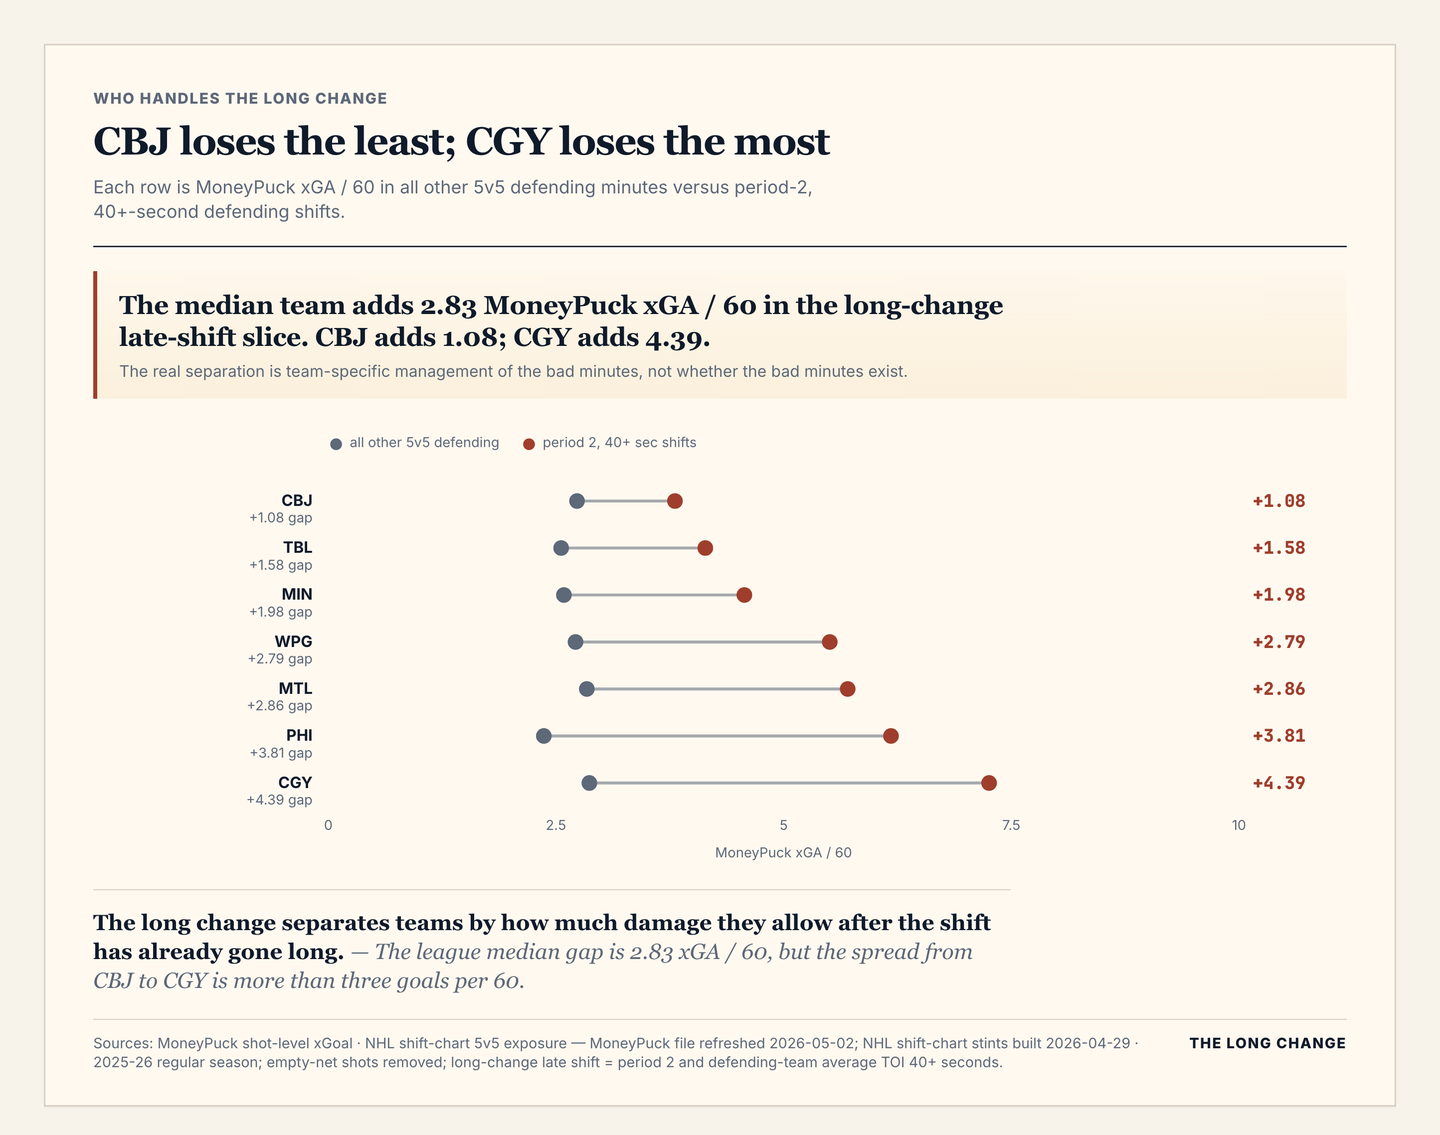
This is where it stops being a league-average story and starts being a team-quality story.
Every team gets worse in the long-change late-shift slice. The median team adds 2.83 MoneyPuck xGoal against per 60 compared with all other 5v5 defending minutes. Columbus loses the least, moving from 2.73 to 3.81. Calgary loses the most, moving from 2.87 to 7.26.
A few things are going on:
- Teams that pre-scout which opponent line is coming over the boards next can match their D-pair to personnel instead of reacting to whoever shows up.
- When to change, and which line to send out ahead of a probable defensive-zone shift, is a coaching decision more than a talent decision. Columbus and Tampa Bay show up best in this pull; Calgary, Philadelphia, St. Louis and Chicago give back the most.
- Teams whose third and fourth lines can be trusted with defensive-zone starts in period 2 keep their stars’ shifts short when the geography is hostile. Teams whose bottom six cannot be trusted get the opposite: their best players take longer shifts because the alternative is worse.
That last point carries the biggest roster implication. A thin bottom six costs you more than the occasional bad goal: it costs you clean changes at the moments they are hardest to make. If you cannot get your fourth line on the ice in the second-period defensive zone, you cannot get your first line off it.
What to take from this
Watch a week of games with the long change in mind and a few familiar ideas get sharper.
A fourth line that can absorb defensive-zone starts in the second period is worth more than the same talent on a fourth line that cannot, which is why “depth you can trust” keeps showing up on winning rosters at prices that look silly in the box score.
Late-shift turnovers follow a schedule. They happen at predictable points in the shift, in the predictable period, for reasons a coaching staff can plan around. A team that files them under bad luck is leaving wins on the table.
And the second period is where coaching shows, even if the public-data line chart is not as clean as the old assumption. Most teams run similar systems on paper. The difference is whose structure survives when the bench is a full sheet of ice away.
Sources and limits
Sources are MoneyPuck xGoal from 2025-26 regular-season shot rows, MoneyPuck regular-season non-empty-net shot location from arena-adjusted coordinates, and NHL shift-chart 5v5 exposure. MoneyPuck rows were refreshed locally on 2026-05-02; NHL shift-chart exposure was built locally on 2026-04-29.
Filters are 5v5, regular season, periods 1-3, and shotOnEmptyNet = 0. The per-60 denominator is reconstructed from NHL shift-chart 5v5 exposure by team, period and average on-ice shift age. Late shift means the defending team’s average time on ice is 40-plus seconds. Inside the dots means |y| < 22 feet and x from the offensive circle tops at 54 feet to the goal line at 89 feet, after flipping all arena-adjusted shot coordinates to one attacking end.