Where Cup Winners Actually Spend Their Money
The past five Cup winners do not point to one magic contract type. They point to a cap shape: core dollars at the top, enough paid depth to survive, and less non-core drag.
Editorial preview. Canonical research draft:
research/2026_cup_winner_cap_shape.md.
Most cap-space conversations get framed the wrong way. The question that gets asked is “can this team afford X player.” The question that should get asked is “does this team’s cap shape look like a contender’s.” Those are not the same question, and the second one is the one the past five Cup winners have answered with a fairly consistent outline.
This is what the cap shape of a Cup winner actually looks like, where it differs from the league’s bottom teams, and what 2026’s contenders should be measuring themselves against.
The contender benchmark
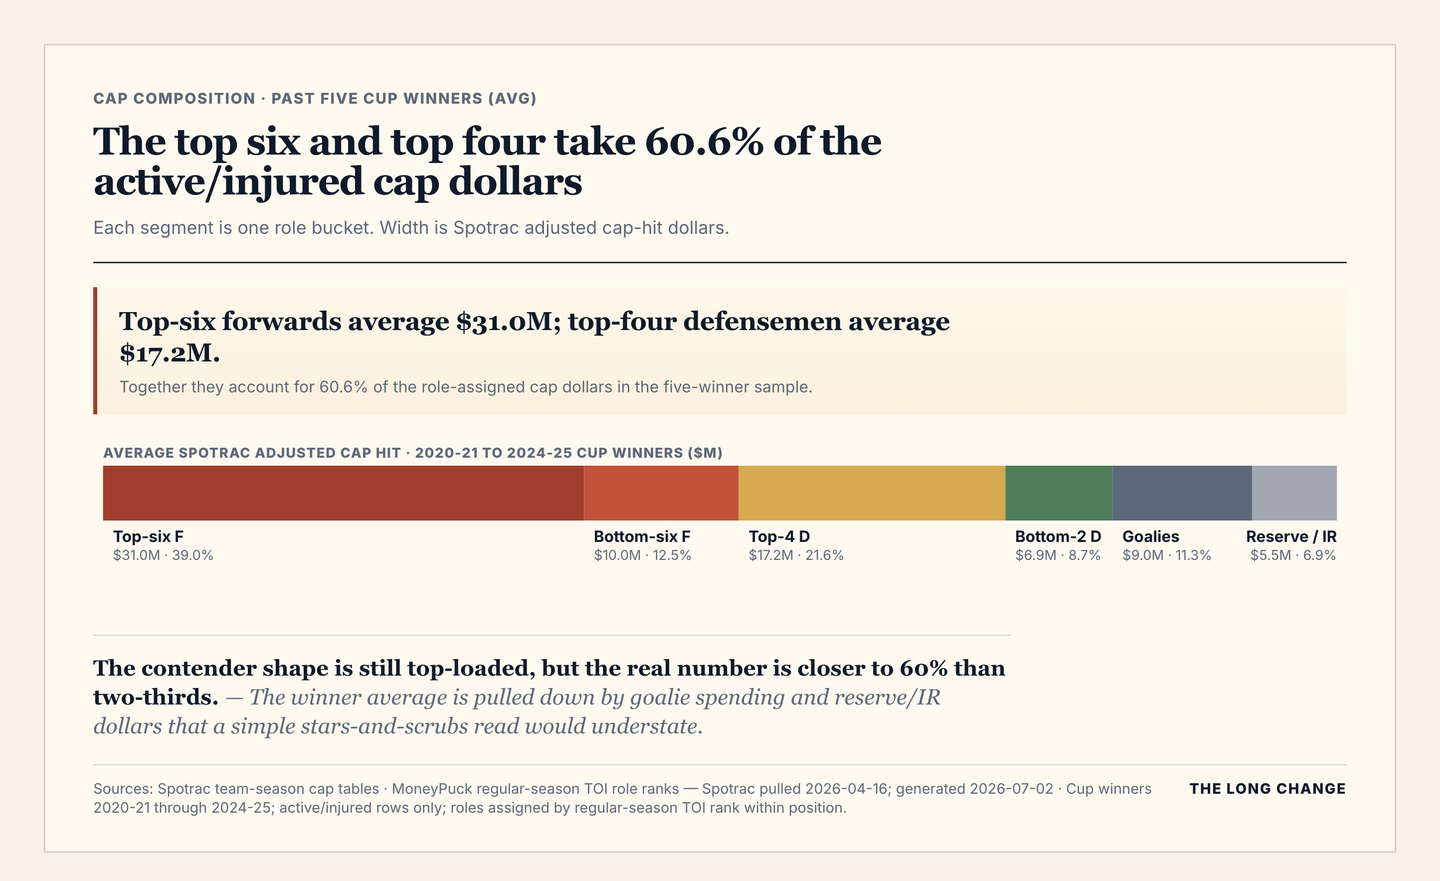
Every Cup winner in the flat-cap era has built a roster with roughly the same proportional shape. Top-six forwards take the biggest piece. Top-four defensemen take the next one. The rest gets divided between goaltending, depth forwards, the bottom defense pair, and the reserve/IR buffer that every roster needs by spring.
In the Spotrac adjusted cap hit pull, the past five Cup winners average $31.0M in top-six forwards and $17.2M in top-four defensemen. Together, those two buckets are 60.6% of the active/injured cap dollars we can assign by role.
That is a description of what has been winning, not a rule for how to spend. A rebuild shaped differently is not automatically wrong, but it is betting against the recent winner template.
The number worth remembering is the concentration. This pull does not get all the way to a clean two-thirds rule. It gets to roughly three-fifths of the role-assigned dollars on top-six forwards and top-four defensemen. If your top ten are not drawing something in that range, your top ten probably are not a Cup top ten.
Where winners actually differ from teams that missed
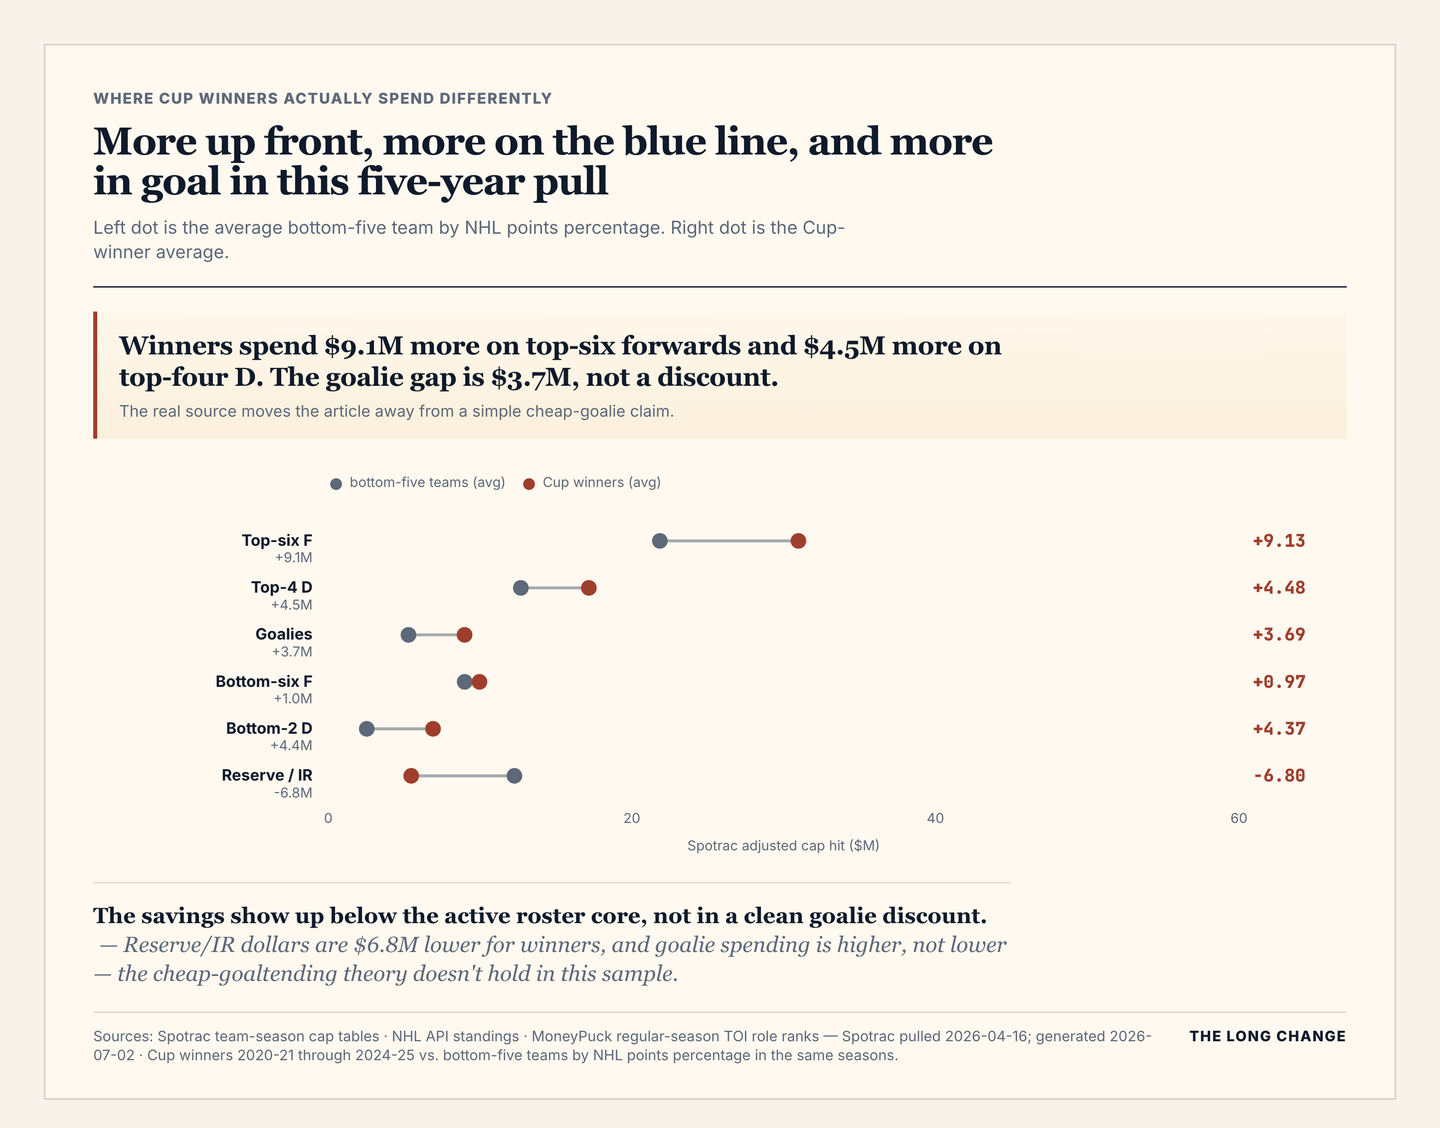
The bucket-by-bucket comparison between Cup winners and the bottom five teams by NHL API standings points percentage is more interesting than the headline composition. The gaps are systematic, but not in the simplest stars-and-scrubs way.
Top-six forwards: +$9.1M. Cup winners spend more on their top six than bottom-five teams do. The gap is big enough to matter: $9.1M spread across six players, not necessarily one $14M star. It can come from one elite contract, three above-average ones, or, most often, a star plus two value deals plus a top-six winger on a market-rate payday.
Top-four D: +$4.5M. Cup winners also spend more on top-four defensemen. The reason is usage: a top-four defenseman who can play 22 minutes against the opponent’s best line in May costs real money, and there is no easy replacement market that gets you that player cheaply.
Goaltending: +$3.7M. In this five-year Spotrac adjusted cap hit pull, Cup winners spend more on goaltending than the bottom-five comparison group, not less — the opposite of the cheap-goaltending folk wisdom. Tampa Bay and Florida alone make it hard to tell a cheap-crease story. The better point is narrower: paying real goalie money can work when the rest of the roster shape still supports it.
Bottom-six and bottom-pair: +$1.0M and +$4.4M. The winners are not simply cheaper at the bottom of the active roster. They are still paying for enough NHL depth to survive a playoff run. The big savings in this setup show up in reserve/IR: winners average $6.8M less there than the bottom-five teams.
Cup teams spend up at the top, still pay for the crease, and avoid letting non-core cap drag swallow the roster. The missed-team comparison is less “stars and scrubs” than “core dollars with less dead space.”
The contract tiers that make it work
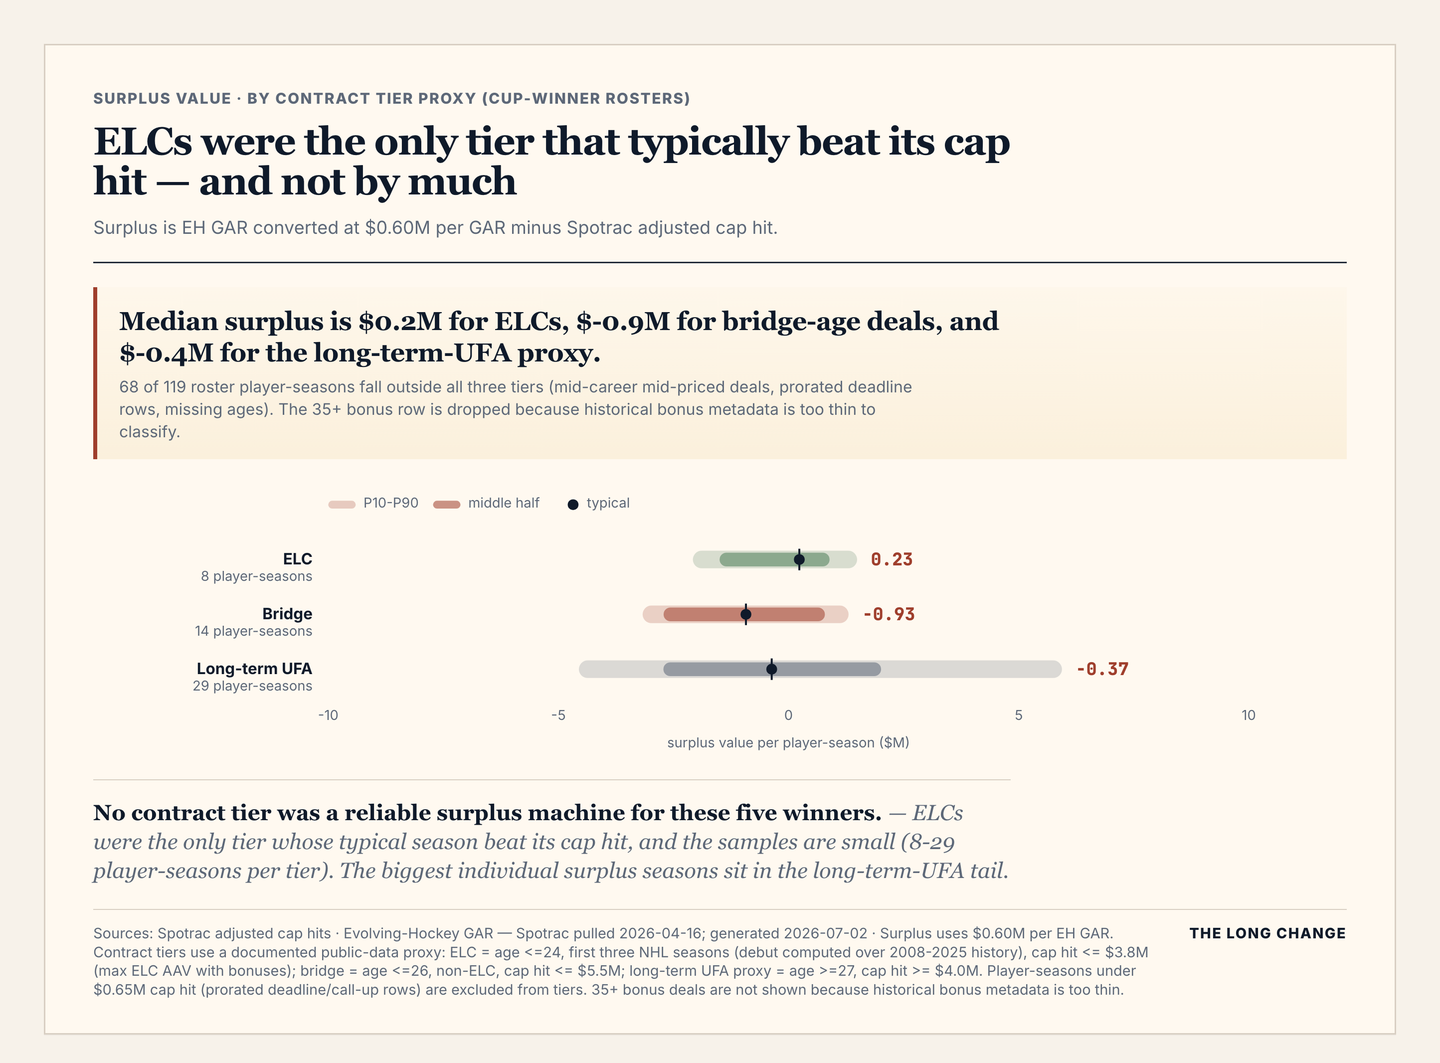
The “spend up at the core” math only works if enough players outrun their cap hit. This is the part that gets called the Evolving Hockey GAR surplus-value proxy: Evolving Hockey GAR converted at $0.60M per GAR, minus Spotrac adjusted cap hit.
The contract-tier picture is blunt, and it is less romantic than the draft version:
- ELCs were the only tier whose typical season beat its cap hit. The median ELC in the public-data tier proxy produced $0.2M of surplus value per season, with the middle half running from -$1.5M to +$0.9M. The best ELCs still matter a lot. The typical one in this Cup-winner pull was modestly positive, not a windfall.
- Bridge-age deals were not free money. The median bridge proxy produced -$0.9M of surplus per season, with the middle half running from -$2.7M to +$0.8M. Teams pay for the projection on those deals, and on these five rosters the projection usually cost more than it returned.
- Long-term UFA-age deals are volatile. The median long-term UFA proxy produced -$0.4M of surplus per season, but the top end is real: the 90th percentile is +$5.9M. This is the bucket where the best front offices need to be right, because the misses are expensive and the hits can still win rounds.
Two disclosures that matter for reading those numbers. First, the samples are small: 8, 14, and 29 player-seasons respectively, so treat the medians as a description of these five rosters, not a law. Second, 68 of the 119 roster player-seasons fall outside all three tiers — mid-career mid-priced contracts, prorated deadline acquisitions, and rows with missing ages. The tiers describe the edges of the roster, not the whole thing.
The 35-plus bonus row is gone. Spotrac’s historical cap tables and the current contract file do not give enough season-specific bonus metadata to classify those deals reliably across 2020-21 through 2024-25. Dropping the row is cleaner than pretending the classification is stronger than it is.
If a team’s cheap-contract pipeline dries up, the cap math gets harder — ELCs were the one tier that typically paid for itself. But the real five-year pull is not a simple ELC sermon either. The largest individual surplus seasons came from goalies, mid-career defensemen, and expensive players who outperformed big numbers.
What to actually look for in a 2026 contender
Take the shape from above and apply it as a check on this season’s rosters.
Top-six and top-four allocation. Does the team have around 60% of its assignable active/injured cap dollars concentrated in the players who will be on the ice for the highest-leverage minutes in May? If not, what is the plausible path: a bridge-age player taking the leap, a UFA target, a homegrown defenseman becoming a top-four answer?
Cheap-contract pipeline. Are the players on entry-level or bridge-age deals plausible NHL contributors, or are they 13F/7D depth-only? A Cup contender usually needs at least a few players whose performance beats their cap number. A pretender often has none.
Bottom-six discipline. Is the bottom six built out of useful contracts, or out of long-term mistakes that force the top of the roster to do too much? The real pull does not say winners spend nothing down the lineup. It says their non-core dollars have to keep working.
Goaltending allocation. Is the team spending big because it has a true difference-maker, or because the market forced a bet it did not want to make? The recent winners do not prove cheap goalies are the path. They prove expensive goalies can fit when the rest of the roster still has a contender shape.
The hinge. Most contenders are one big swing question away from looking like a Cup roster. For some teams it is “does the young defenseman take the leap.” For others it is “does the bridge-age forward earn the next contract.” For others it is “do we accept that the cap math requires moving a long-term contract.” Whichever one it is, name it and build around answering it.
What this view cannot tell you
The cap-shape lens is good at identifying a contender-style roster and bad at handling year-to-year variance. The 2025-26 Cup winner will be more decided by playoff goaltending, health, and one or two players outscoring their projection than by exactly hitting these allocation percentages. Use the shape as a screen for which teams can win, not a model of which team will.
Two more limits worth naming: long-term injury reserve and retained-salary deals distort the cap picture in ways the headline percentage does not capture, and any single Cup winner is one team. The average shape across five Cup winners is the more honest read than fixating on any individual champion’s exact spend.
Sources and limits
Sources are Spotrac adjusted cap hit from team-season cap tables pulled locally on 2026-04-16, Evolving Hockey GAR regular-season files on disk, MoneyPuck regular-season TOI role ranks, MoneyPuck allPlayersLookup.csv birth dates, and NHL API standings points percentage end-date pulls generated by scripts/render_cap_composition_charts.py.
Cup-winner sample: 2020-21 through 2024-25. Comparison sample: the bottom-five teams by NHL API standings points percentage in each of those same seasons. Cap buckets use Spotrac adjusted cap hit where available, active/injured rows only, with top-six F / bottom-six F / top-four D / bottom-two D / goalie / reserve-IR assigned by MoneyPuck regular-season TOI role ranks within position. The Evolving Hockey GAR surplus-value proxy equals Evolving Hockey GAR times $0.60M per GAR minus Spotrac adjusted cap hit. Contract tiers are a documented public-data proxy, not audited contract-history labels: ELC = age 24 or younger, first three NHL seasons (debut computed over the full 2008-2025 player file), cap hit no more than $3.8M; bridge = age 26 or younger, non-ELC, cap hit no more than $5.5M; long-term UFA proxy = age 27 or older, cap hit at least $4.0M. Player-seasons under $0.65M cap hit (prorated deadline or call-up rows) are excluded from tier analysis. The 35-plus bonus tier is omitted because historical bonus metadata is too thin to classify reliably.